
Mid-October: | *2020-2021 Winter Outlook by Perspecta Weather*
Paul Dorian

Current sea surface temperature anomalies are shown from around the world and snow cover as well (in gray); Map courtesy CMC Environment Canada
Overview
The winter season of 2019-2020 actually got off to an impressively cold start in the Mid-Atlantic region during the month of November, but it transitioned in December to one with warmer-than-normal conditions and those positive temperature anomalies continued for the vast majority of the time in the months of January, February and March. Perhaps not surprisingly, snowfall turned out to be well below-normal last winter to go along with the overall relatively warm weather conditions. In fact, some spots in the Mid-Atlantic region featured their lowest snow totals for a winter season since 1972-1973.

Numerous factors have been examined for this year’s “Winter Outlook” including the strong prospects for a moderately strong La Nina event in the tropical Pacific Ocean, somewhat favorable signs for high-latitude blocking events, and an analysis of “analog” winters that featured similar oceanic conditions to today’s environment. Many signs point to colder-than-normal conditions this winter season across the northern US including in the Mid-Atlantic region and the virtually snowless winter of last year is quite likely not going to repeat itself.

Dynamical and statistical model forecasts of El Nino Southern Oscillation (ENSO) from September 2020; plot courtesy International Research Institute for Climate and Society
Key Factors
Several of the key factors considered for this year’s “Winter Outlook” by Perspecta Weather are listed below:
1. Moderately strong La Nina conditions in the equatorial Pacific Ocean; warmer-than-normal water in the northeastern Pacific
2. Some positive signs for “high-latitude blocking” events:
a. low solar activity
b. increasing autumnal snowpack in the Northern Hemisphere
c. trends in teleconnection indices
3. An analysis of analog years suggests colder-than-normal temperatures across the northern US with normal-to-slightly above normal snowfall amounts in the Mid-Atlantic region; warmer, drier than normal weather in much of the western and southern US
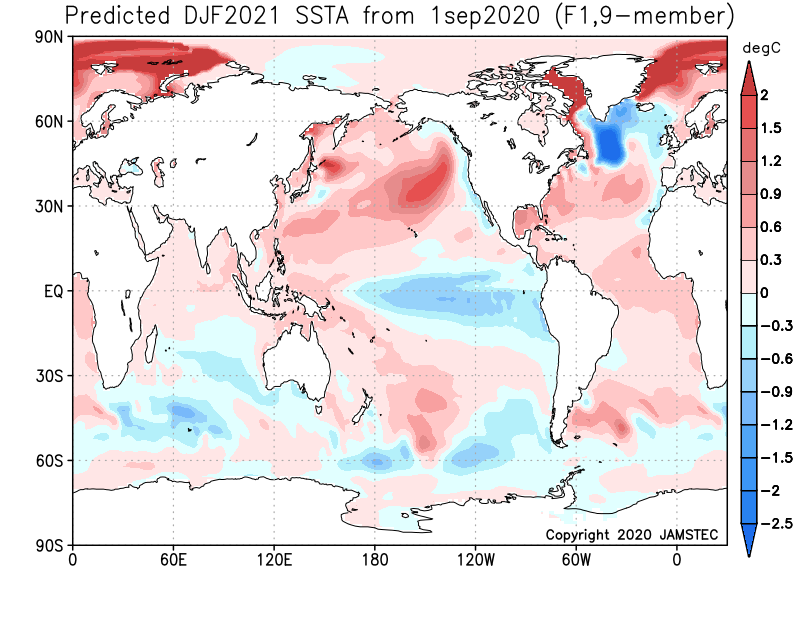
Japan Agency for Marine-Earth Science and Technology (JAMSTEC) forecast of sea surface temperature anomalies for the winter season (DJF 2020/2021); Map courtesy JAMSTEC
La Nina in the equatorial Pacific Ocean
The Pacific Ocean is the largest on the planet, covers more than 30 percent of the Earth’s surface, and is bigger than the landmass of all the continents combined. The warm waters of the equatorial Pacific Ocean store a great amount of latent heat compared to cooler waters and breed a great deal of convection which impact downstream ridging and troughing in the atmosphere. As such, its sea surface temperature (SST) pattern has a tremendous influence on all weather and climate around the world and the more anomalous the sea surface temperatures, the more the impact can be on the atmosphere around the world. The El Nino-Southern Oscillation (ENSO) is a recurring climate pattern involving changes in the temperature of waters in the central and eastern tropical Pacific Ocean. El Nino and La Nina are the extreme phases of the ENSO cycle; between these two phases is a third phase called ENSO-neutral.
During last winter season, weak El Nino conditions (i.e., warmer-than-normal) dominated in the central part of the equatorial Pacific Ocean, but that sea surface temperature pattern began to shift this spring to one with colder-than-normal conditions as La Nina began to form. Those La Nina conditions intensified this summer and are quite likely to persist right through the upcoming winter season.

La Nina will be the dominant player this winter season in the equatorial Pacific Ocean with colder-than-normal sea surface temperatures. Typically, this type of oceanic sea surface temperature pattern leads to a strong polar jet across Canada and the US and colder-than-normal conditions from Alaska to the Northern Plains. In addition, La Nina winters are often warmer and drier than normal in much of the western and southern US.
SST Anomalies in the northeastern Pacific Ocean
While the equatorial part of the Pacific Ocean is likely to feature colder-than-normal sea surface temperatures this winter season, an expansive area of warmer-than-normal water persists in the northeastern part of the ocean. This area of warmer-than-normal water has actually been quite consistent in this region for much of the past decade. This prominent sea surface temperature anomaly is connected to the Pacific Decadal Oscillation (PDO) which is a robust, recurring pattern of ocean-atmosphere climate variability centered over the mid-latitude Pacific basin. Persistent warmer-than-normal water in the northeastern Pacific Ocean during the winter season usually correlates with an upper-level ridge of high pressure near Alaska and this can, in turn, result in colder-than-normal conditions to persist in an area from northwestern Canada to the Northern Plains.
While I do expect these colder-than-normal air masses to make their way into the Mid-Atlantic on a fairly regular basis this winter season, a battle may develop in the atmosphere in this particular part of the country between the cold push of air from the northwest and high pressure ridging that is likely to pop up often in the Southeast US. In years in which a persistent high pressure ridge sits over the Southeast US, these cold air masses that originate in Canada can have great difficulty making their way into the Mid-Atlantic region. Indeed, this was the often repeated scenario last year and it is something to be monitored this upcoming winter season.

Moderately strong La Nina conditions during a winter season tend to favor warmer conditions compared to normal in much of the southern and western US and colder-than-normal weather from the Northern Plains to the Mid-Atlantic/Northeast US.
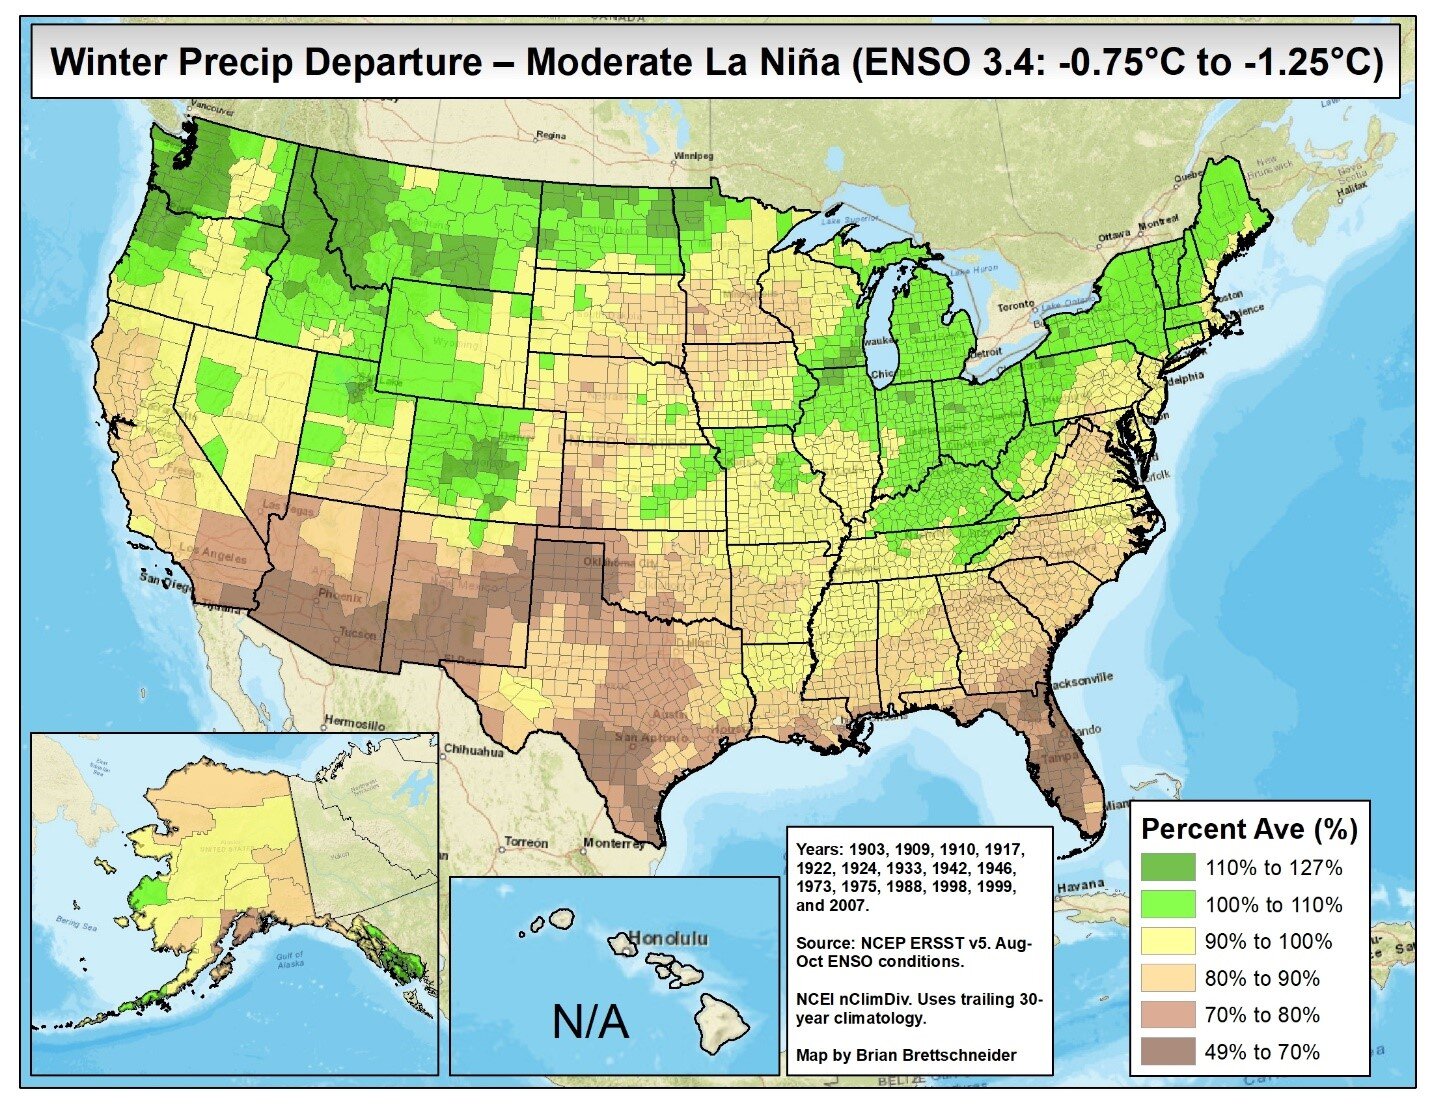
Moderately strong La Nina conditions during a winter season tend to favor drier conditions compared to normal across much of the southern and western US and normal to wetter-than-normal in the northern US.
“High-latitude blocking” and some favorable signs
As any snow lover and weather enthusiast knows living in the Mid-Atlantic and Northeast US, it takes many ingredients to fall into place for a snowstorm to actually take place; especially, in the urban areas of DC, Philly, New York City and Boston. One requirement for accumulating snow is, of course, cold air that is near or below the freezing mark, but it can be a little more complicated than that. It is one thing to have cold air around at the beginning of a potential snowstorm, but the best chance for significant snow comes when there is sustained cold air. If there is no mechanism for “locking in” the cold air, you could very well end up with a snow-changing-to-rain scenario; especially, in the big cities along the I-95 corridor and in areas closer to the coast.
One of the ways to sustain a cold air mass in the Mid-Atlantic/Northeast US is to have an atmospheric phenomenon known as “high-latitude blocking”. High-latitude blocking during the winter season is characterized by persistent high pressure in northern latitude areas such as Greenland, northeastern Canada, and Iceland. Without this type of blocking pattern in the upper atmosphere, it is more difficult to get sustained cold air masses in the central and eastern US as well as, in turn, accumulating snowfall.
Three signals that can provide clues as to the prospects for “high-latitude blocking” in an approaching winter season include solar activity, autumnal snowpack buildup in the Northern Hemisphere, and recent trends in teleconnection indices such as the Arctic Oscillation (AO) and North Atlantic Oscillation (NAO). All three of these signals tend to support the notion that “high-latitude blocking” may indeed be quite prevalent during this upcoming winter season which favors colder-than-normal weather in the central and eastern US and more snow than normal.

A recent solar image (left) shows spotless conditions which has happened more than 70% of the time in 2020 as the sun continues to experience solar minimum conditions. Solar cycles in recent decades have been in a weakening trend with daily observations of the number of sunspots shown since 1 January 1977 (right). The thin blue line indicates the daily sunspot number, while the dark blue line indicates the running annual average. Data source: Solar Influences Data Analysis Center (SIDC), WDC-SILSO, Royal Observatory of Belgium, Brussels, climate4you.com. Last diagram update: 2 October 2020.
Low solar activity
In the long term, the sun is the main driver of all weather and climate and multi-decadal trends in solar activity can have major impacts on oceanic and atmospheric temperatures. In addition, empirical observations have shown that the sun can have important ramifications on weather and climate on much smaller time scales. For example, research and empirical observations have shown that low solar activity (in terms of sunspots) tends to be well correlated with frequent “high-latitude blocking” patterns in the winter season. We are currently in the latter stages of a deep solar minimum and solar activity should hold at relatively low levels during the upcoming winter season.
A look at 500 millibar height anomalies from recent solar minimum time periods in the winter season shows a clear signal of “high-latitude blocking” with higher-than-normal geopotential heights a dominant feature near Greenland and Iceland. This type of upper air pattern which is prevalent during low solar activity winters can lead to numerous sustained cold air outbreaks into the central and eastern US during a given winter season and also favors more snow than normal. In fact, some of the greatest snowstorms in the Mid-Atlantic/Northeast US took place in low solar activity winters including, for example, those in February 2010, December 2009, and January 1996. There are, of course, other important factors to consider in the prediction of accumulating snow along the I-95 corridor including sea surface temperatures in the western Atlantic Ocean and the positioning of polar and sub-tropical jet streaks.

Low solar activity years are well correlated with abnormally high geopotential height anomalies at 500 millibars over high-latitude regions such as Greenland and Iceland (shown in red, orange, yellow); Data courtesy NOAA/NCAR
The "Siberian snowpack” signal
Snowpack in the Northern Hemisphere and, in particular, Siberia during the autumn season has been found to be an important predictive factor with respect to “high-latitude blocking” patterns during subsequent winter seasons. In fact, research studies have actually pinpointed the region in Siberia below 60°N during the month of October as critical with respect to the likelihood of “high-latitude blocking” patterns during the following winter season. If snowpack is above-normal and consistently expanding during October in that part of Siberia, research studies and empirical observations suggest there is an increased chance for more frequent “high-latitude blocking” configurations in subsequent winter months. In fact, there has been a noticeable increase in snowpack across Siberia during the first couple of weeks in October including in the region south of 60°N.

Snowpack has increased noticeably across Eurasia during the past couple of weeks and research has shown that a rapid increase in snow in that particular region can increase chances for sustained cold air outbreaks into the central and eastern US in subsequent winter months; Snow and ice data courtesy NOAA/National Ice Center
Recent trends in teleconnection signals (AO, NAO)
“High-latitude blocking” is tracked by meteorologists through indices known as the Arctic Oscillation (AO) and its closely-related cousin called the North Atlantic Oscillation (NAO). The AO refers to opposing atmospheric pressure patterns in middle and high latitudes. When the AO is positive, for example, surface pressure is low in the polar region and this helps the mid-latitude jet stream to blow strongly and consistently from west-to-east keeping Arctic air locked up in the polar region. When the AO index is negative, there tends to be high pressure in the polar region (i.e., “high-latitude blocking”), weaker zonal winds, and greater movement of polar air into the middle latitudes such as the Mid-Atlantic region.

Arctic Oscillation (AO, top) and North Atlantic Oscillation (bottom) have largely been neutral to negative in recent days; Data courtesy NOAA/CPC
The NAO is a weather phenomenon in the North Atlantic Ocean of fluctuations in the difference of atmosphere pressure between the Icelandic low and Azores high. It controls the strength and direction of westerly winds and the location of storms tracks across the North Atlantic. It is part of the Arctic Oscillation and varies over time with no particular periodicity. During winters when the NAO is in its positive mode, the presence of the strong high-pressure and strong low-pressure systems produces warmer, wetter conditions over northern Europe and most of northeastern North America. During winters governed by the negative mode of the NAO, colder conditions are brought to eastern North America and northern Europe mainly by more-frequent intrusions of Arctic air. North America receives additional snow, while Europe receives less precipitation than normal.
Observations have shown that trends that develop in the autumn with respect to teleconnection indices such as the AO and NAO often foreshadow what will happen in subsequent winter months. Both of these indices have been primarily neutral-to-negative in recent days and are suggestive of somewhat favorable prospects for “high-latitude blocking” events during the upcoming winter season.
An analysis of analog years
In addition to the analysis of oceanic and solar cycles, it is quite useful, in my opinion, for long-range forecasting purposes to find analog years in which there were similar oceanic conditions compared to today’s environment. The review of temperature and precipitation patterns in these analog years can provide some useful clues as to what can be expected in the upcoming winter season. For the selection of these analog years, I focused primarily on the moderately strong La Nina expected in the tropical Pacific Ocean. Given these conditions, I have found five analog years of 2010, 2013, 1970, 2017 and 1975 that featured somewhat similar oceanic temperature patterns compared to today.

Mean SST anomaly using these 5 analog years for August-September-October 2020 and it matches quite well the current conditions around the world with La Nina featured in the equatorial Pacific; Data courtesy NOAA, tropicaltidbits.com
When averaged together, these five analog years produced a pretty clear signal for colder-than-normal conditions from the Northern Plains to the Mid-Atlantic/Northeast US along with warmer-than-normal conditions in much of the western and southern US. This type of temperature pattern is pretty typical of a wintertime La Nina sea surface temperature pattern in the tropical Pacific Ocean.


US temperature (top) and precipitation (bottom) anomalies averaged together during the December-to-February time period for the five analog years. Data courtesy NOAA/PSL
The overall signal from the analog years’ precipitation anomaly pattern is for nearly normal total precipitation amounts in the Mid-Atlantic region and Northeast US. Nearly normal total precipitation amounts should actually result in slightly above-normal snowfall amounts given the fact that it should be a winter with slightly colder-than-normal overall temperatures. Much of the southern half of the nation is likely to experience drier-than-normal weather this winter season based on analysis of these analog years and the expectation of high pressure ridging to persist in the Southeast US. In addition, there is reason to believe that much of the snow this winter season in the Mid-Atlantic region and Northeast US may come on the back end during the months of February and March. In addition, winter’s chill will likely linger this year right into the spring equinox time period based on analysis of the analog years.

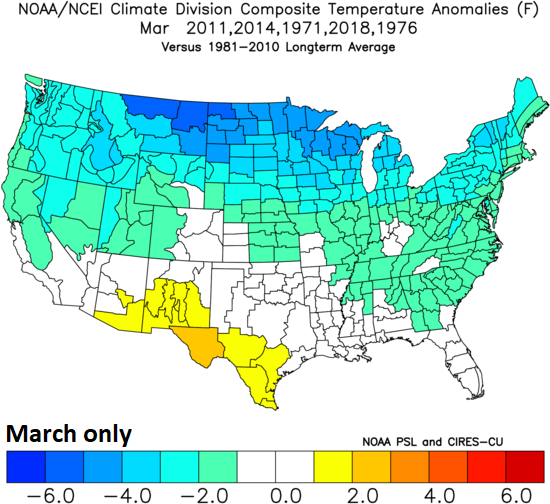
Precipitation anomalies averaged together for the month of February (top) in the 5 analog years and temperature anomalies averaged together for the month of March (bottom). Much of the precipitation in the analog years fell in the latter stages of the winter season and colder-than-normal conditions lasted well into the month of March. Data courtesy NOAA
The bottom line
The Mid-Atlantic region should experience slightly colder-than-normal temperatures this winter season and normal-to-slightly above-normal snowfall amounts based upon an analysis of such factors as global sea surface temperature anomalies, the likelihood of “high-latitude blocking” events, and an evaluation of analog years. Much of the snow in the Mid-Atlantic region may come in the second half of the winter season (i.e., February, March) as winter weather conditions will tend to hang on as we push towards the spring equinox. Elsewhere in the US, colder-than-normal conditions appear likely this winter from the Northern Plains-to-New England and warmer, drier weather conditions compared to normal should dominate across much of the southern and western US with especially dry conditions possible across California.
In terms of specific numbers for the Mid-Atlantic region, temperatures should average from 0.5-1.5°C below-normal for the winter season and snowfall estimates in the DC-to-Philly-to-NYC corridor are as follows:
~20 inches in Washington, D.C with ~25 inches in the DC suburbs including around Dulles Airport (VA);
~25 inches in Philadelphia, PA with ~30 inches in the Philly suburbs;
~30 inches in Central Park, NY with ~35 inches in the NYC suburbs.
We will continue to closely monitor all of these oceanic, atmospheric and solar factors over the next several weeks and as we progress through the winter season of 2020-2021.
Meteorologist Paul Dorian
Perspecta, Inc.
perspectaweather.com
Extended video discussion: