
1:05 PM (Wednesday) | *Arctic sea ice has shown resiliency in recent years*
Paul Dorian

While still at below-normal levels, Arctic sea ice extent is higher now than it has been during 13 of the last 15 years for this time of year with the only exceptions being 2009 and 2008; map courtesy National Snow and Ice Data Center
Overview
Sea ice covers about 7% of the Earth’s surface and about 12% of the world’s oceans and forms mainly in the Earth’s polar regions. Specifically, much of the world’s sea ice is found within the Arctic ice pack of the Arctic Ocean in the Northern Hemisphere and the Antarctic ice pack of the Southern Ocean in the Southern Hemisphere. While the Antarctic sea ice extent is currently running at levels very close-to-normal, the Arctic sea ice extent is below-normal and has been running generally at below-normal levels since the middle 1990’s at which time there was a long-term phase shift from cold-to-warm in the North Atlantic Ocean sea surface temperature pattern. In recent years, however, the Arctic sea ice has actually shown great resiliency and is currently at higher levels for this time of year when compared to all but two years going back to 2005.

Atlantic Multidecadal Oscillation (AMO) monthly index values from 1960 to 2019 with negative (cold) sea surface temperature phases shown in blue and positive (warm) phases shown in red. A long-term phase shift from cold-to-warm took place in the middle 1990’s and Arctic sea ice extent flipped at that time from consistently above-normal levels to below-normal; AMO index data courtesy daculaweather.com
Atlantic Multidecadal Oscillation (AMO)
The Atlantic Multidecadal Oscillation (AMO) is a climate cycle that affects the sea surface temperature pattern of the North Atlantic Ocean on multidecadal timescales. The northern Atlantic Ocean switched sea surface temperature phases from cold-to-warm back in the middle 1990’s and this shift was directly correlated with the flipping of Arctic sea ice extent from above-normal levels at that time to generally below-normal thereafter until present. The sea surface temperature phase in the northern Atlantic Ocean is tracked by meteorologists with the Atlantic Multidecadal Oscillation (AMO) index and it has generally been in a positive (warm) phase since the middle 1990’s. In those initial years after the AMO phase shift, the Arctic sea ice extent dropped rather steadily. Over the past several years, however, the Arctic sea ice extent has stabilized with much more of a sideways trend as compared with the clear downward trend of the late 1990’s and early 2000’s.

Arctic sea ice extent (solid blue line in circled region) is currently below the 1981-2010 median (solid gray line) for this time of year, but it has been quite resilient in recent years and is now within the interdecile range (light shade of gray) and above the record minimum year of 2012 (red dashed line); map courtesy National Snow and Ice Data Center
Polar vortex
This winter season has been rather favorable for the build-up of ice in the Arctic region with sustained cold and sea ice extent actually currently exceeds all but two years (2008, 2009) going back to 2005 at this stage of the winter season. This winter season has been somewhat typical for the Arctic region with overall temperatures for December and January not far from normal. Part of this can be attributed to the fact that the polar vortex has been stationed over the polar region more often than not this winter season. A polar vortex is a low-pressure system of cold polar air - a normal weather phenomenon - but in some recent winter seasons such as 2013-2014, this feature was occasionally displaced to lower latitudes or even broken up into multiple pieces. The result of this change to the more typical positioning and/or magnitude of the polar vortex in the winter of 2013-2014 was for abnormally cold air to frequently push into North America and, often times in that particular winter, there was less sustained harsh cold for the Arctic region compared to normal. Temperature anomalies for December and January of this winter season of 2019-2020 show overall fairly close-to-normal temperatures over the Arctic region with pockets of above-normal (e.g., near the North Pole) and below-normal (e.g., Alaska, Greenland) whereas the winter season of 2013-2014 featured generally above-normal temperatures throughout the polar region. One thing to note is that even above-normal temperatures during the Arctic winter season will be well below the freezing mark allowing for some buildup of ice in the region. The Arctic sea ice extent will typically reach a yearly peak during the latter part of their winter season which ends in late March.

Temperature anomalies are shown for the Arctic region for the December/January time periods from this winter season of 2019-2020 (left) and 2013-2014 (right). Overall temperatures were relatively close-to-normal this past December and January (white represents normal), but averaged above-normal (yellow, green, red) during the same two months in the winter of 2013-2014 when the polar vortex was occasionally displaced to lower latitudes or broken up into multiple pieces. Maps courtesy NOAA/NCEP, NCAR reanalysis
Sideways trend in Arctic sea ice volume since 2010
In addition to sea ice extent, an important climate indicator to monitor is sea ice volume as it depends on both ice thickness and extent. Arctic sea ice volume cannot currently be observed on a continuous basis as observations from satellites, submarines and field measurements are all limited in space and time. As a result, one of the best ways to estimate sea ice volume is through the usage of numerical models which utilize all available observations.

Arctic sea ice volume from the University of Washington’s PIOMAS numerical model which is updated on a monthly basis (details on the PIOMAS model are available here)
One such computer model from the University of Washington is called the Pan-Arctic Ice Ocean Modeling and Assimilation System (PIOMAS, Zhang and Rothrock, 2003) and it is showing a sideways trend in Arctic sea ice volume since around 2010 which followed a downward trend since the AMO phase shift in the middle 1990’s.
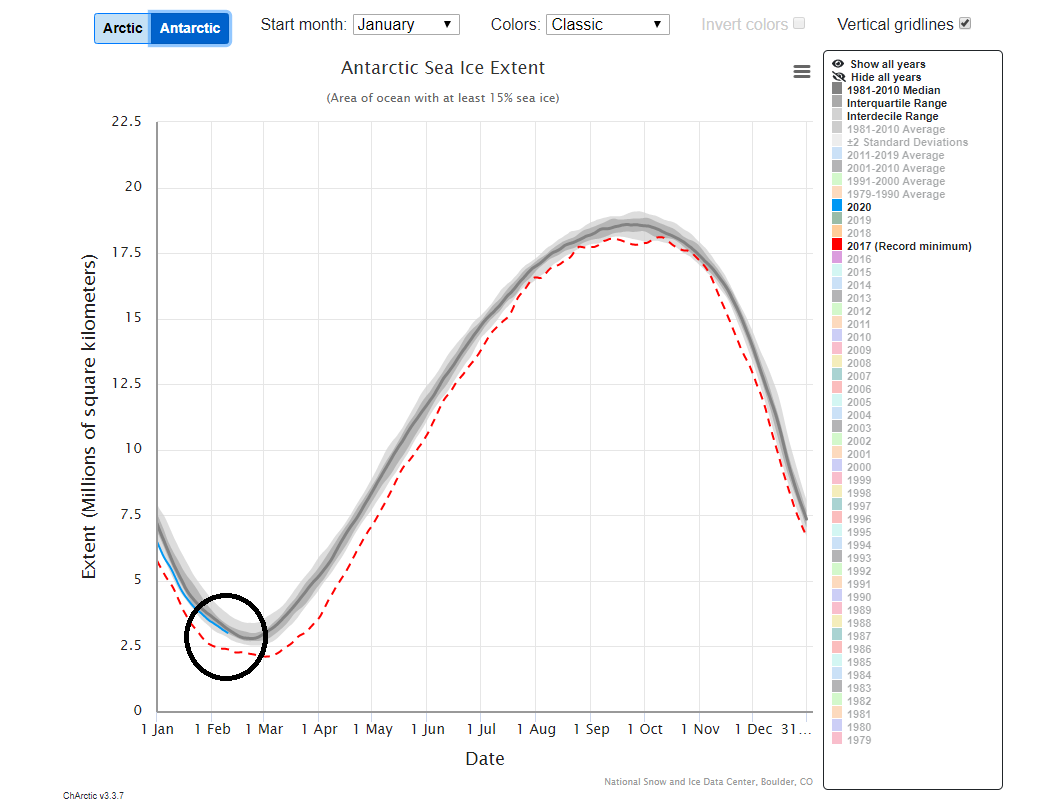
Antarctic sea ice extent (solid blue line in circled region) is currently very close to the 1981-2010 median (solid gray line) for this time of year and well above the record minimum year of 2017(red dashed line). Map courtesy National Snow and Ice Data Center
Antarctica
Sea ice extent in Antarctica is actually rather close-to-normal for this time of year, but it has not been a smooth ride to this point in recent years. Unlike Arctic sea ice, there was a general upward trend in sea ice extent in Antarctica from the 1990’s to the middle part of this past decade. In 2016, however, there was a sudden and large drop off in Antarctica sea ice extent to low levels not seen in the satellite era. There is some belief that this sudden and dramatic drop off in Antarctic sea ice extent was caused by a series of remarkable and unprecedented storms over the Southern Ocean during the latter part of 2016 (source). These storms brought warm air and strong winds from the north that melted some 30,000 square miles per day in that particular time period. In recent years, the sea ice surrounding Antarctica has bounced back and is now very close to the median of the 30-year base period of 1981-2010. The Antarctic sea ice extent will typically reach a yearly low point during the latter part of their summer season which ends in late March.
Meteorologist Paul Dorian
Perspecta, Inc.
perspectaweather.com
Follow us on Facebook, Twitter, YouTube