1:45 PM | Pattern change likely to take place around New Year's Day
Paul Dorian
Overview
The month of December has been much warmer-than-normal in the Mid-Atlantic region and there are several warm days still to come during this week and next. Indeed the month of December could turn out to be the warmest ever in much of the region aided in large part by the strong El Nino oceanic cycle in the tropical Pacific Ocean. So far this month temperatures have averaged 10.6°F above normal in Philadelphia, 11.3°F above normal in Central Park, NY, and 7.6°F above normal in Washington, D.C (Reagan National Airport). There are signs; however, for an important change in the overall weather pattern that is likely to occur around the New Year’s Day holiday period and it should bring quite a change in temperatures to the eastern states from well above normal to much closer-to-normal.
Madden Julian Oscillation
The MJO is a tropical disturbance that propagates eastward around the global tropics with a cycle on the order of 30-60 days. It is a large-scale coupling between atmospheric circulation and tropical deep convection. The MJO has wide ranging impacts on the patterns of tropical and extratropical precipitation, atmospheric circulation, and surface temperature around the global tropics and subtropics. Furthermore, the MJO influences both precipitation and surface temperature patterns across the US. Specifically, one significant impact of the MJO in the U.S. during the northern hemisphere winter is an increase in the frequency and intensity of cold air outbreaks across the central and eastern US.
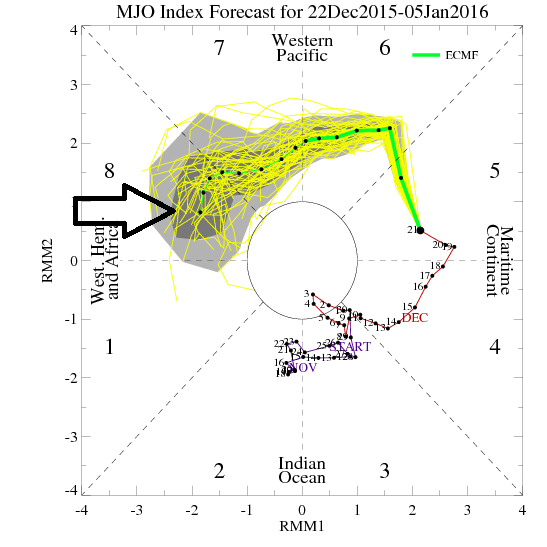
MJO index forecast from December 22nd to January 5th by the European model
MJO Forecast and Phases
Research has found that the location of the MJO, or phase, is linked with certain temperature and precipitation patterns around the world. The MJO phase diagram illustrates the recent and forecasted progression of the MJO index through different phases which generally coincide with locations along the equator around the globe. When the index is within the center circle, the MJO is considered weak, meaning it is difficult to discern. Outside of this circle, the index is stronger and will usually move in a counter-clockwise direction as the MJO moves from west to east. The European computer model forecast of the MJO index propagates it from its current "phase 5" location into "phase 8" as we progress from December 22nd to January 5th (follow green line in figure above in a counter-clockwise fashion to arrow indicator). Phase 8 (as well as phases 1 and 2) for the MJO index this time of year (i.e., December/January/February) typically signals colder-than-normal temperatures in the eastern U.S. (see circled area below in "phase 8" temperature composite chart).

Temperature composites by phase for MJO index in December/January/February time period
GFS 500 millibar height anomaly forecasts
The European computer forecast model is putting out a signal for colder weather in the eastern states come the New Year with its MJO forecast as described above and NOAA’s GFS model is suggesting a similar change in temperatures with its 500 millibar height anomaly forecast. The current setup features strong high pressure ridging in the eastern states and upper level low pressure across the western US. This persistent pattern in December has generated a very warm month relative-to-normal east of the Mississippi River and generally cold weather and above-normal snowfall out in the western states. The 72-hour forecast map from today’s (12Z) GFS model run has a continuation of this pattern on Christmas morning (left, below) with ridging in the East (orange) and deep upper level low pressure (blue) out in the West. All of this flips by the time New Year’s Day rolls around in the latest GFS 500 mb height anomaly forecast (right, below) with deep upper level low pressure (blue) in the southeastern US and ridging (orange) popping up in the western US. This kind of a shift in the upper atmosphere pressure pattern would allow for cold air outbreaks to reach the Mid-Atlantic region on a more consistent basis compared to recent weeks with temperatures much closer-to-normal for this time of year.

12Z GFS 500 millibar height anomaly forecast for Christmas Day and New Year's Day
Stay tuned – we’ll continue to monitor this potential significant pattern change over the next several days.
Meteorologist Paul Dorian
Vencore, Inc.