
2:55 PM | *Teleconnections and stratospheric warming support the notion that winter is not over yet*
Paul Dorian

Current stratospheric temperature analysis (left) and 10-day forecast (right); courtesy NOAA
Overview
Meteorologists track atmospheric pressure and temperatures patterns around the world through numerous index values including the Arctic Oscillation (AO), North Atlantic Oscillation (NAO) and Pacific North American (PNA). These teleconnection indices can provide useful information regarding upcoming temperature patterns based on their current and forecasted phase (positive or negative) and the given time of year. For example, prospects for future cold air outbreaks into the eastern US can be assessed through the trends in indices such as the PNA, AO and especially the NAO during this late phase of the winter season. For the most part, these teleconnections are pointing to more cold air outbreaks for the eastern US as we roll over into the month of March.
Another way to monitor the potential for Arctic air outbreaks in the northern U.S. is to follow what is happening in the stratosphere over the polar region of the northern hemisphere. Sudden stratospheric warming (SSW) events are large, rapid temperature rises in the winter polar stratosphere occurring primarily in the Northern Hemisphere. They have been found to often set off a chain of events in the atmosphere that ultimately lead to Arctic air outbreaks from northern Canada into the central and eastern U.S. Indeed, there is stratospheric warming taking place right now over portions of the polar region and another significant warm up in the upper part of the atmospheric is predicted ten days from now. This unfolding stratospheric warming event provides an additional reason to believe that cold air outbreaks will continue in the eastern US during the month of March.

Teleconnection indices including the AO, NAO and PNA (black=past, current; red=forecasted); courtesy NOAA
Stratospheric warming
During the winter months in the lower polar stratosphere, temperatures are typically lower than minus 70° Celsius (purple area above). The cold temperatures are combined with strong westerly winds that form the southern boundary of the stratospheric polar vortex. The polar vortex plays a major role in determining how much Arctic air spills southward toward the mid-latitudes. This dominant structure is sometimes disrupted in some winters or even reversed. Under these circumstances, the temperatures in the lower stratosphere can rise by more than 50°K in just a few days. This sets off a reversal in the west-to-east winds and the collapse of the polar vortex or a shifting of it from its usual position over the North Pole to another part of the polar region. In response to the stratospheric warming at the high latitudes, the troposphere in turn cools down dramatically and this cold air displacement is then transported from the tropospheric high latitudes to the tropospheric middle latitudes. The current temperature pattern at 10 millibars shows stratospheric warming (arrow) on one side of the North Pole and there is another substantial area of warming ten days from now (arrow) as forecasted by the GFS computer model.

Composite temperature anomalies for March during positive PNA phase; map courtesy Mad US Weather, NOAA
Teleconnections including the PNA, AO, NAO
High-latitude blocking is tracked by meteorologists through indices known as the Arctic Oscillation (AO) and its closely-related cousin called the North Atlantic Oscillation (NAO). The Arctic Oscillation refers to opposing atmospheric pressure patterns in middle and high latitudes. When the AO is positive, for example, surface pressure is low in the polar region and this helps the mid-latitude jet stream to blow strongly and consistently from west-to-east keeping Arctic air locked up in the polar region. When the AO index is negative, there tends to be high pressure in the polar regions (i.e., high-latitude blocking), weaker zonal winds, and greater movement of polar air into the middle latitudes. The AO and NAO index plots show past levels (black) and forecasted levels (red) for the foreseeable future. The AO is already in negative territory and should remain there in the near future. The NAO is headed towards neutral or perhaps even negative territory (Euro supports negative phase). During the month of March, negative AO values typically result in colder-than-normal conditions for the eastern US (and most of the country. Neutral-to-negative NAO values generally point to near normal or colder-than-normal conditions respectively across the eastern US.
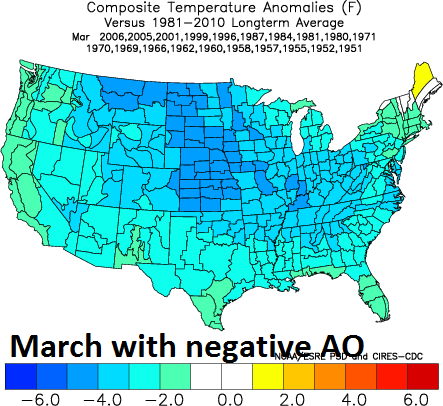
Composite temperature anomalies for March during negative AO phases; map courtesy Mad US Weather, NOAA
While AO and NAO values are used primarily to provide some information to meteorologists regarding prospects for high-latitude blocking, the PNA can be used for assessing the atmospheric pattern in the North Pacific Ocean. Indeed, positive phases of PNA during this part of the winter season generally favor the likelihood for high pressure ridging along the west coasts of Canada and the US and this, in turn, usually results in cold air outbreaks for the eastern US with near normal to colder-than-normal conditions.

Composite temperature anomalies for March during negative NAO phase (left) and neutral NAO (right); map courtesy Mad US Weather, NOAA
Bottom Line
Stay tuned - more cold air outbreaks are likely as we progress through the month of March and that means accumulating snow could still threaten the Mid-Atlantic region - perhaps on a couple of occasions. In fact, there can be a snow threat in the Mid-Atlantic region as early as the latter part of next week. Despite the likelihood for more cold air outbreaks in March, there will also be warm spells as we approach the spring equinox. In fact, the second week of March is looking particularly spring-like in the eastern US. One final note, as the southern branch of the jet stream gets renewed life during the month of March, the state of California is quite likely to get hit hard by Pacific Ocean "El-Nino enhanced" storms.
Meteorologist Paul Dorian
Vencore, Inc.