
8:00 AM | *Earth’s upper atmosphere cooling off dramatically and cosmic rays continue to increase as deep solar minimum approaches*
Paul Dorian

Daily observations of the number of sunspots since 1 January 1977 according to Solar Influences Data Analysis Center (SIDC). The thin blue line indicates the daily sunspot number, while the dark blue line indicates the running annual average. The recent low sunspot activity is clearly reflected in the recent low values for the total solar irradiance. Compare also with the geomagnetic Ap-index. Data source: WDC-SILSO, Royal Observatory of Belgium, Brussels. Last day shown: 31 October 2018. Last diagram update: 1 November 2018.
Overview
The sun is blank again today and has been without sunspots about 60% of the time this year as the current historically weak solar cycle heads towards the next solar minimum. Solar cycle 24 is currently on pace to be the weakest sunspot cycle with the fewest sunspots since cycle 14 peaked in February 1906. Solar cycle 24 continues a recent trend of weakening solar cycles which began with solar cycle 21 that peaked around 1980. The last time the sun was this blank in a given year on a percentage basis was 2009 during the last solar minimum when 71% of the time was spotless. That last solar minimum actually reached a nadir in 2008 when an astounding 73% of the year featured a spotless sun - the most spotless days in a given year since 1913. All indications are that the fast-approaching next solar minimum may be even quieter than the last one which was the deepest in nearly a century.
One of the natural consequences of a solar minimum is for the upper part of the Earth’s atmosphere to cool down. Another natural impact of decreasing solar activity is the weakening of the ambient solar wind and its magnetic field which, in turn, allows more cosmic rays to penetrate the solar system. The intensification of cosmic rays can have important consequences on such things as the safety of airline passengers and astronauts in space, Earth’s cloud cover and climate, and possibly even on lightning.

Above: Layers of the atmosphere. Credit: NASA
Possible record-breaking cooling in the thermosphere
One of the most important ways the solar cycle affects our planet is by cooling off the thermosphere during solar minimum. The thermosphere is the part of the earth's atmosphere that begins at about 50 miles (80 kilometers) above the earth's surface, extends to outer space, and is characterized by steadily increasing temperature with height. New data from NASA’s SABER instrument on board NASA’s TIMED satellite confirms the notion that our atmosphere is losing heat energy near the edge of space as we approach solar minimum. In fact, if current trends continue, it could soon set a Space Age record for cold according to NASA. There is good news and bad news in all of this. The good news is that when the thermosphere cools, it actually shrinks, thereby reducing drag on satellites in low Earth orbit which can increase the life of a satellite. The bad news is that this cooling aloft tends to delay the natural decay of space junk resulting in a more cluttered environment around Earth.
Thermosphere Climate Index (TCI)
The SABER instrument has been in orbit for only 17 years and it monitors infrared radiation from carbon dioxide (CO2) and nitric oxide (NO), two substances that play a vital role in the energy output of our thermosphere, the very top level of our atmosphere. By measuring the infrared glow of these molecules, SABER can assess the thermal state of gas at the very top of the atmosphere in the thermosphere. NASA has actually created an index called the Thermosphere Climate Index (TCI) to measure how much NO is dumped from the thermosphere into outer space. During the solar maximum phase, TCI is very high and it is low at the time of solar minimum.
According to NASA, the TCI is currently very low indeed as SABER is measuring 33 billion watts of infrared power from NO which is ten times smaller than what is seen during more active phases of a solar cycle. In fact, TCI numbers are very close to setting a record and that could very well happen sometime during the next several months (source). Although SABER has been in orbit for only 17 years, NASA has calculated the TCI going all the way back to the 1940s. According to NASA, “SABER taught us to do this by revealing how TCI depends on other variables such as geomagnetic activity and the sun’s UV output–things that have been measured for decades”.

Above: An historical record of the Thermosphere Climate Index. Mlynczak and colleagues recently published a paper on the TCI showing that the state of the thermosphere can be discussed using a set of five plain language terms: Cold, Cool, Neutral, Warm, and Hot. Source: spaceweather.com
Cosmic Rays
Galactic cosmic rays are high-energy particles originating from outside the solar system that can impact the Earth’s atmosphere. Our first line of defense from cosmic rays comes from the sun as its magnetic field and the solar wind combine to create a 'shield' that fends off cosmic rays attempting to enter the solar system. The shielding action of the sun is strongest during Solar Maximum and weakest during Solar Minimum with the weakening magnetic field and solar wind. The intensity of cosmic rays varies globally by about 15% over a solar cycle because of changes in the strength of the solar wind, which carries a weak magnetic field into the heliosphere, partially shielding Earth from low-energy galactic charged particles
Evidence of an increase in stratospheric radiation
One way to monitor cosmic ray penetration into the Earth’s upper atmosphere is to measure stratospheric radiation over an extended period of time. “Spaceweather.com” has led an effort since 2015 to monitor radiation levels in the stratosphere over the US with frequent high-altitude helium balloon flights. These balloons contain sensors which detect X-rays, gamma-rays and neutrons in the stratosphere produced by the crash of primary cosmic rays into Earth's atmosphere. The sensors sample energies between 10 keV and 20 MeV, spanning the range of medical X-ray machines, airport security devices, and "killer electrons" in Earth's radiation belts.

Above: Dose rates at the Regener-Pfotzer Maximum, a layer of peak radiation about 20 km above Earth’s surface. Source
The initial monitoring effort focused on the state of California, but has since expanded to a dozen other states including the following: NV, OR, WA, ID, WY, KS, NE, MO, IL, ME, NH, VT. Every one of these states has seen an upward trend in radiation according to spaceweather.com ranging from +20% in central California to +33% in Maine. The latest points (circled in red) were gathered during a ballooning campaign in August-October 2018.
Consequences of increasing cosmic rays
1) Threat to airline passengers and astronauts exploring in space
Cosmic radiation at aviation altitudes is typically 50 times that of natural sources at sea level. Pilots are classified as occupational radiation workers by the International Commission on Radiological Protection (ICRP) and, according to a recent study from researchers at the Harvard School of Public Health, flight attendants face an elevated risk of cancer compared to members of the general population.

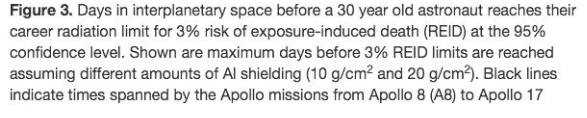
Not only can an increase of cosmic rays have an impact on airplane passengers, it may have a dangerous impact on astronauts as they explore space. A newly published paper supports the finding of an increase in cosmic rays as solar activity continues to diminish and we approach the next solar minimum and the authors, led by Prof. Nathan Schwadron of the University of New Hampshire, show that radiation from deep space is dangerous and intensifying faster than previously predicted. The story begins four years ago when Schwadron and colleagues first sounded the alarm about cosmic rays. Analyzing data from the Cosmic Ray Telescope for the Effects of Radiation (CRaTER) instrument onboard NASA's Lunar Reconnaissance Orbiter (LRO), they found that cosmic rays in the Earth-Moon system were peaking at levels never before seen in the Space Age. The worsening radiation environment, they pointed out, was a potential peril to astronauts, curtailing how long they could safely travel through space. This figure (above) from their original 2014 paper shows the number of days a 30-year old male astronaut flying in a spaceship with 10 g/cm2 of aluminum shielding could go before hitting NASA-mandated radiation limits. In the 1990s, the astronaut could spend 1000 days in interplanetary space. In 2014 … only 700 days. "That's a huge change," says Schwadron.
The shielding action of the sun is strongest during Solar Maximum and weakest during Solar Minimum–hence the 11-year rhythm of the mission duration plot above. The problem is, as the authors note in their new paper, the shield is weakening: "Over the last decade, the solar wind has exhibited low densities and magnetic field strengths, representing anomalous states that have never been observed during the Space Age. As a result of this remarkably weak solar activity, we have also observed the highest fluxes of cosmic rays."
2) Cloud cover and climate
The correlation between cosmic rays and cloud cover over a solar cycle was first reported by Svensmark and Friis-Christensen in 1997. A more recent study by Svensmark published in the August 2016 issue of Journal of Geophysical Research: Space Physics continues to support the idea of an important connection between cosmic rays and clouds. In this publication, the authors found that “the observed variation of 3–4% of the global cloud cover during the recent solar cycle is strongly correlated with the cosmic ray flux. This, in turn, is inversely correlated with the solar activity. The effect is larger at higher latitudes in agreement with the shielding effect of the Earth's magnetic field on high-energy charged particles. The above relation between cosmic ray flux and cloud cover should also be of importance in an explanation of the correlation between solar cycle length and global temperature that has been found”.
3) Possible lightning trigger
Finally, there has been some research suggesting there is a connection between cosmic rays and lightning (paper 1, paper 2). When cosmic rays smash into molecules in our atmosphere, the collisions create showers of subatomic particles, including electrons, positrons, and other electrically charged particles. This shower of electrons would collide into still more air molecules, generating more electrons. All in all, cosmic rays could each set off an avalanche of electrons and trigger lightning.
Meteorologist Paul Dorian
Perspecta, Inc.
perspectaweather.com