
11:40 AM | *The quietest sun since 2009*
Paul Dorian
The sun is blank today for the 15th day in a row and has been blank 52% of the time this year; Image courtesy NASA
Overview
The sun is blank today for the 15th straight day which is the longest stretch without sunspots since November 2009 when the sun was emerging from the deepest solar minimum in a century. This year the sun has been blank 52% of the time which is the most in a given year since the 71% that took place in 2009. The last solar minimum actually reached a nadir in 2008 when an astounding 73% of the year featured a spotless sun - the most spotless days in a given year since 1913 - and the longest consecutive streak in 2008 reached 52 days according to spaceweather.com. All indications are that the upcoming solar minimum may even be even quieter than the last one. One of the natural consequences of low solar activity is the weakening of the solar wind and its magnetic field which, in turn, allows for the intensification of cosmic rays and easier access to Earth. In addition, there tends to be a drop in total solar irradiance with the approach of a solar minimum.

Daily observations of the number of sunspots since 1 January 1900 according to Solar Influences Data Analysis Center (SIDC). The thin blue line indicates the daily sunspot number, while the dark blue line indicates the running annual average. The recent low sunspot activity is clearly reflected in the recent low values for the total solar irradiance. Data source: WDC-SILSO, Royal Observatory of Belgium, Brussels. Last day shown: 31 May 2018. Last diagram update: 1 June 2018. (Credit: climate4you.com)
Solar Cycle 24
The current solar cycle is the 24th solar cycle since 1755 when extensive record-keeping of sunspot activity began and it on pace to be the weakest sunspot cycle since cycle 14 peaked in February 1906. Solar cycle 24 began in December 2008 and had minimal activity until early 2010 and then reached a maximum in April 2014. Solar cycle 24 continues a recent trend of weakening solar cycles which began when solar cycle 21 peaked around 1980 and some are already forecasting the next solar cycle (#25) to be even weaker than this current one (e.g., reference 1, reference 2).
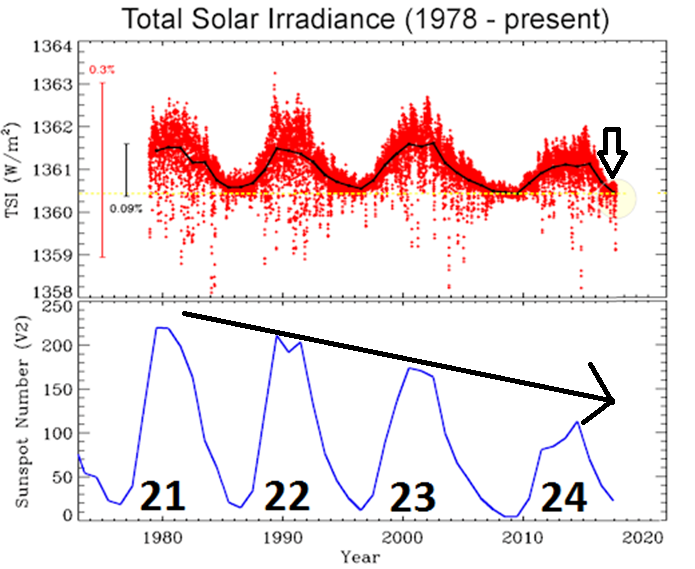
Total solar irradiance (TSI) is a measure of the absolute intensity of solar radiation, integrated over the entire solar irradiance spectrum. The top plot shows the TSI since 1978 as observed from nine different satellites and it is currently in decline as the next solar minimum rapidly approaches. The bottom plot shows the sunspots number in recent solar cycles which have been in an overall weakening trend since the solar cycle 21 peaked around 1980. Source
An increase in cosmic rays
Galactic cosmic rays are high-energy particles originating from outside the solar system that can impact the Earth’s atmosphere. Our first line of defense from cosmic rays comes from the sun as its magnetic field and the solar wind combine to create a 'shield' that fends off cosmic rays attempting to enter the solar system. The shielding action of the sun is strongest during Solar Maximum and weakest during Solar Minimum with the weakening magnetic field and solar wind. The intensity of cosmic rays varies globally by about 15% over a solar cycle because of changes in the strength of the solar wind, which carries a weak magnetic field into the heliosphere, partially shielding Earth from low-energy galactic charged particles (source).
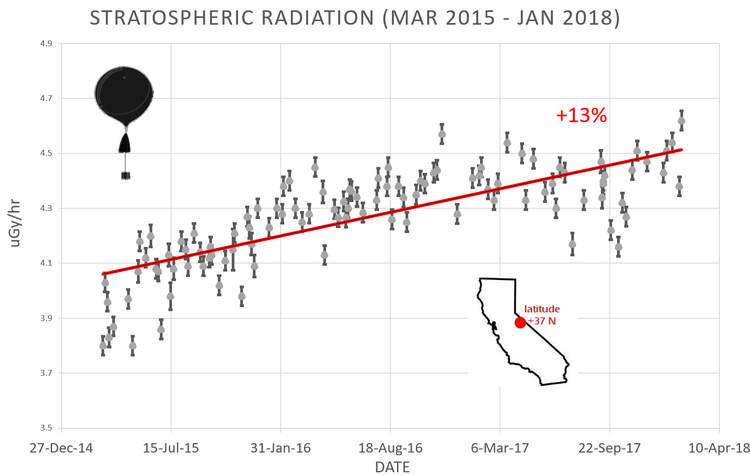
Spaceweather.com has sponsored the launching of space weather balloons to the stratosphere almost weekly since 2015. Sensors onboard those balloons show a 13% increase in radiation (X-rays and gamma-rays) penetrating our planet's atmosphere between March 2015 and January 2018.
One way to monitor cosmic ray penetration into the Earth’s upper atmosphere is to measure stratospheric radiation over an extended period of time. “Spaceweather.com” has led an effort for nearly three years to monitor radiation levels in the stratosphere over California with frequent high-altitude helium balloon flights. These balloons contain sensors which detect X-rays and gamma-rays in the energy range 10 keV to 20 MeV and are produced by the crash of primary cosmic rays into Earth's atmosphere. These energies span the range of medical X-ray machines and airport security scanners. The findings confirm the notion that indeed cosmic rays have been steadily increasing over California as solar cycle 24 heads towards the next solar minimum. In fact, there has been a 13% increase of stratospheric radiation over California from March 2015 to January 2018.
Consequences of increasing cosmic rays: cloud cover/climate
The correlation between cosmic rays and cloud cover over a solar cycle was first reported by Svensmark and Friis-Christensen in 1997. A more recent study by Svensmark published in the August 2016 issue of Journal of Geophysical Research: Space Physics continues to support the idea of an important connection between cosmic rays and clouds.
In this publication, the authors found that “the observed variation of 3–4% of the global cloud cover during the recent solar cycle is strongly correlated with the cosmic ray flux. This, in turn, is inversely correlated with the solar activity. The effect is larger at higher latitudes in agreement with the shielding effect of the Earth's magnetic field on high-energy charged particles. The above relation between cosmic ray flux and cloud cover should also be of importance in an explanation of the correlation between solar cycle length and global temperature”.
Decrease in total solar irradiance
In addition to the increase in cosmic ray penetration as solar minimum approaches, the total solar irradiance (TSI) tends to drop and there has already been a measured drop of nearly 0.1% compared to the output during the solar cycle 24 maximum phase which took place from 2012-2014. A change of 0.1% may not sound like much, but the sun deposits a lot of energy on the Earth, approximately 1,361 watts per square meter. Summed over the globe, a 0.1% variation in this quantity exceeds all of Earth’s other energy sources (such as natural radioactivity in Earth’s core) combined. NASA recently launched a new sensor (TSIS-1) to the International Space Station to closely monitor these TSI changes.

The “Maunder Minimum” was an extended period of low solar activity during the latter half of the 17th century and the beginning of the 18th century in a cold period now referred to as the “Little Ice Age”. (Credit for plot: wikipedia)
Final thoughts
It’s important to note that solar minimum is a normal part of the sunspot cycle. Sunspots have been disappearing every 11 years or so since 1843 when German astronomer Samuel Heinrich Schwabe discovered the periodic nature of solar activity. Sometimes they go away for decades, as happened during the Maunder Minimum of the second half of the 17th century and early part of the 18th century in a cold period now referred to as the “Little Ice Age”.
Meteorologist Paul Dorian
Perspecta, Inc.
perspectaweather.com