
9:00 AM | "2019-2020 Winter Outlook" by Perspecta Weather
Paul Dorian

Current sea surface temperature anomalies; map courtesy CMC Environment Canada
Overview
Last winter began early in the Mid-Atlantic region with significant accumulating snow in many spots before Thanksgiving Day and November turned out to be a colder-than-normal month. The rest of the winter season, however, was fairly mild with temperatures averaging slightly above-normal in the I-95 corridor and snowfall was generally near normal-to-slightly below-normal. In Philly, for example, the coldest month relative-to-normal was November (2018) with monthly average temperatures 3.9 degrees below the normal. The warmest month relative-to-normal turned out to be December (2018) with +2.8 degrees departure from normal. As has been the case in recent years, winter was hard to shake off at the end of the season as there were more cold air outbreaks and even accumulating snow as late as the middle of March. Numerous factors have been examined for this year’s “Winter Outlook” including current sea surface temperature anomalies, the likelihood of high-latitude blocking events, and a comparison with analog years that featured somewhat similar oceanic conditions to today’s environment.
Key Factors
The key factors to this year’s Perspecta Weather “Winter Outlook” are listed below:
1. Much warmer-than-normal water mass in the northeastern Pacific Ocean
2. Weak El Nino conditions are likely in the tropical Pacific Ocean
3. Somewhat favorable signs for “high-latitude blocking”
a. low solar activity
b. increasing autumnal snowpack in the Northern Hemisphere
c. teleconnection indices
4. Comparison with “analog years” suggests colder-than-normal temperatures and nearly normal precipitation amounts for the central and eastern US

The consistent upper-level pattern over the past several months has featured high pressure ridging near Alaska and Greenland and this pattern should continue into the winter season. Plot courtesy NOAA/NCAR
The all-important Pacific Ocean
The Pacific Ocean is the planets biggest, covers more than 30 percent of the Earth’s surface, and is larger than the landmass of all the continents combined. As such, its sea surface temperature (SST) pattern has a tremendous influence on all weather and climate around the world. During last winter season, weak El Nino conditions (i.e., warmer-than-normal) dominated in the central part of the equatorial Pacific Ocean and there were generally warmer-than-normal sea surface temperatures in the northeastern part of the ocean. In general, this overall sea surface temperature pattern in the Pacific Ocean is not all that different from what I expect this winter season; however, the warm mass of water in the northeastern section looks like it will be more extensive and even warmer than last year.
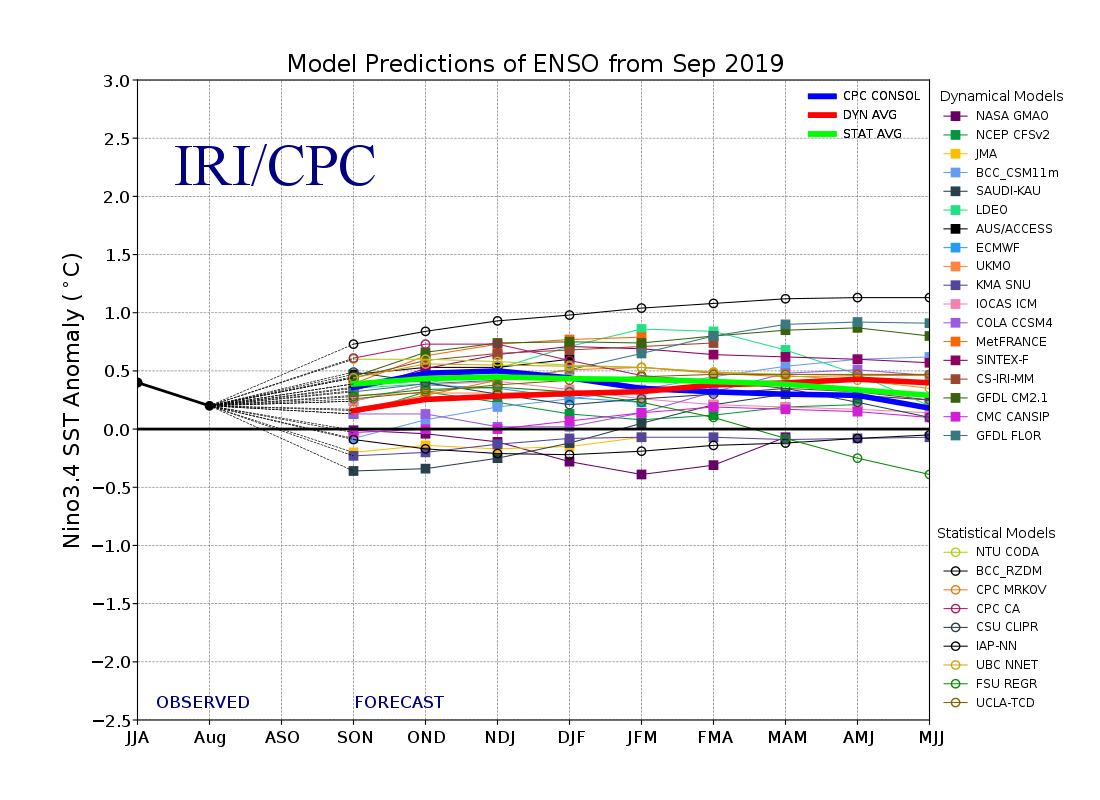
Dynamical and statistical model forecasts of El Nino Southern Oscillation (ENSO) from September 2019; plot courtesy International Research Institute for Climate and Society
Northeastern Pacific Ocean
The warm water in the northeastern Pacific Ocean which persisted during much of the middle part of this decade (2013-2015) has intensified an expanded in the past few months. This prominent sea surface temperature anomaly is connected to the Pacific Decadal Oscillation (PDO) which is a robust, recurring pattern of ocean-atmosphere climate variability centered over the mid-latitude Pacific basin. Persistent warmer-than-normal water in the northeastern Pacific Ocean during the winter season usually correlated with an upper-level ridge of high pressure near Alaska and along the west coast of Canada. This, in turn, promotes a dip in the jet stream downstream in the central and eastern US which helps to promote the delivery of cold air from the northern part of Canada into these areas. There has actually been persistent upper-level ridging centered near Alaska during the summer season associated with this warm mas of water and this overall pattern is likely to continue into the winter season.
There were numerous noteworthy cold air outbreaks during the winters of 2013-2014 and 2014-2015 when this warm water mass previously existed in the northeastern Pacific and there was a persistent upper-level ridge of high pressure near Alaska and the west coast of Canada. Last winter, more often than not, it was on the mild side in the eastern US as strong high pressure ridging over the southeast US tended to counteract any cooling effects from the same type of sea surface temperature pattern in the northeastern Pacific. I do not believe the southeast US ridge that dominated the scene last winter will be quite as prevalent this winter season partly as a result of somewhat colder-than-normal water sitting just off the coast.
Japan Agency for Marine-Earth Science and Technology (JAMSTEC) forecast of sea surface temperature anomalies for the winter season (DJF 2019/2020); courtesy JAMSTEC
Weak El Nino in the equatorial Pacific
In the tropical Pacific Ocean, there is a batch of colder-than-normal water off the west coast of South America, but some warmer-than-normal water remains in the central region near the International Date Line. Many computer forecast models suggest the weak El Nino will continue through the winter season in the central part of the tropical Pacific. From a historical point-of-view, weak El Nino tends to favor colder-than-normal weather in the eastern half of the nation during the winter months of December, January and February.

Weak El Nino conditions tend to favor colder-than-normal conditions in the eastern half of the nation during the months of December, January, and February.
Somewhat favorable signs for “high-latitude blocking”
As any snow lover and weather enthusiast knows living in the I-95 corridor, it takes many ingredients to fall into place for a snowstorm to actually take place; especially, in the urban areas of DC, Philly, New York City and Boston. One requirement for accumulating snow is, of course, cold air near or below freezing, but it can be a little more complicated than that. It is one thing to have cold air around at the beginning of a potential snowstorm, but the best chance for significant snow comes when there is sustained cold air. If there is no mechanism for “locking in” the cold air, you could very well end up with a snow-changing-to-rain scenario; especially, in the big cities along the I-95 corridor and in all areas closer to the coast.
One of the ways to sustain a cold air mass in the Mid-Atlantic/NE US is to have an atmospheric phenomenon known as high-latitude blocking. High-latitude blocking during the winter season is characterized by persistent high pressure in northern latitude areas such as Greenland, northeastern Canada, and Iceland. Without this type of blocking pattern in the upper atmosphere, it is more difficult to get sustained cold air masses in the eastern US during the winter season. In addition to the increased chance of sustained cold air during low solar activity years, high-latitude blocking in the upper atmosphere tends to slow down the movement and departure of storms along the Mid-Atlantic/NE US coastlines and this too increases the chances for significant snowfall as long as there is entrenched cold air. In fact, some of the greatest snowstorms in the Mid-Atlantic/NE US regions took place in low solar activity winters including, for example, those in February 2010, December 2009, and January 1996. There are, of course, other important factors in addition to solar activity to consider in the prediction of accumulating snow along the I-95 corridor including sea surface temperatures in the western Atlantic and the positioning of polar and sub-tropical jet streaks.
Three signals that can provide clues as to the prospects for high-latitude blocking this winter include solar activity, autumnal snowpack buildup in the Northern Hemisphere, and the recent history of teleconnection indices such as the Arctic Oscillation (AO) and North Atlantic Oscillation (NAO). All three of these signals tend to support the notion that high-latitude blocking may indeed be quite prevalent during this upcoming winter season which generally favors colder-than-normal weather in the central and eastern US and more snow than normal.

Daily observations of the number of sunspots since 1 January 1900 according to Solar Influences Data Analysis Center (SIDC). The thin blue line indicates the daily sunspot number, while the dark blue line indicates the running annual average. The recent low sunspot activity is clearly reflected in the recent low values for the total solar irradiance. Data source: WDC-SILSO, Royal Observatory of Belgium, Brussels. Last day shown: 30 September 2019. Plot courtesy “climate4you.com”.
Low solar activity
In the long term, the sun is the main driver of all weather and climate and multi-decadal trends in solar activity can have major impacts on oceanic and atmospheric temperatures. In addition, empirical observations have shown that the sun can have important ramifications on weather and climate on much smaller time scales. For example, research and empirical observations have shown that low solar activity (in terms of sunspots) tends to be well correlated with frequent high-latitude blocking patterns in the winter season. We have now entered into what is likely to be a deep solar minimum solar activity should be low during the upcoming winter season. A look at 500 millibar height anomalies from recent solar minimum time periods in the winter season shows a clear signal of high-latitude blocking with higher-than-normal geopotential heights a dominant feature near Greenland and Iceland. This type of upper air pattern which is prevalent during low solar activity winters can lead to numerous sustained cold air outbreaks into the central and eastern US during a given winter season and also favors more snow than normal.

Low solar activity years are well correlated with abnormally high geopotential height anomalies at 500 millibars over high-latitude regions such as Greenland and Iceland (shown in red, orange, yellow); data courtesy NOAA/NCAR
The "Siberian snowpack "signal
Snowpack in the Northern Hemisphere and, in particular, Siberia during the autumn season has been found to be an important predictive factor with respect to high-latitude blocking patterns during subsequent winter seasons. In fact, research studies have actually pinpointed the region in Siberia below 60°N during the month of October as critical with respect to the likelihood of high-latitude blocking patterns during the following winter season. If snowpack is above-normal and consistently expanding during October in that part of Siberia, research studies and empirical observations suggest there is an increased chance for more frequent high-latitude blocking configurations in subsequent winter months. In fact, there has been an increase in snowpack across Siberia during the first couple of weeks October including in the region south of 60°N. The snowpack in Siberia at the middle of October is actually higher than in most recent years and this is a potentially a positive sign for high-latitude blocking.

Snowpack has increased markedly in the first couple of weeks of October across Eurasia and research has shown that a rapid increase in snow this time of year in Eurasia with above normal snowfall generally favors a colder winter in the eastern US; data courtesy NOAA
Teleconnection signals (AO, NAO)
High-latitude blocking is tracked by meteorologists through indices known as the Arctic Oscillation (AO) and its closely-related cousin called the North Atlantic Oscillation (NAO). The AO refers to opposing atmospheric pressure patterns in middle and high latitudes. When the AO is positive, for example, surface pressure is low in the polar region and this helps the mid-latitude jet stream to blow strongly and consistently from west-to-east keeping Arctic air locked up in the polar region. When the AO index is negative, there tends to be high pressure in the polar region (i.e., high-latitude blocking), weaker zonal winds, and greater movement of polar air into the middle latitudes such as the Mid-Atlantic region.
The NAO is a weather phenomenon in the North Atlantic Ocean of fluctuations in the difference of atmosphere pressure between the Icelandic low and Azores high. It controls the strength and direction of westerly winds and the location of storms tracks across the North Atlantic. It is part of the Arctic oscillation and varies over time with no particular periodicity. During winters when the NAO is in its positive mode, the presence of the strong high-pressure and strong low-pressure systems produces warmer, wetter conditions over northern Europe and most of northeastern North America. During winters governed by the negative mode of the NAO, colder conditions are brought to eastern North America and northern Europe mainly by more-frequent intrusions of Arctic air. North America receives additional snow, while Europe receives less precipitation than normal.
While the AO and NAO indices are perhaps more important to weather forecasters during winter months, trends in the summer and fall seasons can provide important clues about the ensuing winter season. Both of these indices have been primarily neutral-to-negative in recent months and should that pattern continue, this would favor colder and snowier weather in the eastern US. Last year, the AO and NAO were largely in positive territory during the summer and fall seasons of 2018.

Arctic Oscillation (AO, top) and North Atlantic Oscillation (bottom) have largely been neutral or negative in recent months; plots courtesy NOAA
“Analog” years
In addition to the analysis of oceanic and solar cycles, it is quite useful for long-range forecasting purposes to find analog years in which there were similar oceanic conditions compared to today’s environment. For the selection of analog years, I focused on the large area of warmer-than-normal water in the northeastern Pacific Ocean as well as the weak El Nino signal coming from the tropical Pacific. In addition to sea surface temperature anomalies, I also placed an emphasis on those winters which featured low solar activity as that is a very high probability for this upcoming winter season given the solar minimum phase that is now underway. Given these conditions, I have found the following five analog years that were somewhat similar to today’s oceanic temperature pattern: 1962-1963, 2004-2005, 2013-2014, 2014-2015 and 2018-2019. Also, I have placed a special emphasis on two (1962-1963, 2018-2019) of these five years that featured low solar activity by “double-weighting” them when generating the average of the temperature and precipitation anomalies during the analog years.

Sea surface temperature anomalies during the winter months of the analog years are quite similar to current conditions; courtesy NOAA
When averaged together, these five analog years produced a pretty clear signal for colder-than-normal conditions in much of the eastern two-thirds of the nation along with warmer-than-normal conditions in the western US. This type of temperature pattern can indeed unfold given the expectation of persistent high-latitude blocking and upper-level ridging along the west coast of Canada and another persistent high pressure near Greenland/Iceland. The warmer-than-normal water in the northeastern Pacific Ocean in recent months has been correlated with strong ridging around Alaska and Greenland and this general pattern should continue this winter.
The overall signal from the analog year precipitation anomaly pattern is for near normal total precipitation amounts which could actually lead to slightly above normal snowfall in a colder-than-normal winter season. Much of the western third of the nation is likely to experience drier-than-normal weather this winter season based on comparison with the analog years and the expectation of high pressure ridging to persist along the west coast of Canada and US.

Temperature (left) and precipitation (right) anomalies averaged together during the December-to-March time period in the five analog years. (Note: the winters of 1962-1963 and 2018-2019 were “double-weighted” in the generation of these anomalies as they were low solar activity years much like the current environment).
The bottom line
The Mid-Atlantic region should experience slightly colder-than-normal temperatures this winter season and slightly above-normal snowfall amounts based upon such factors described above as current sea surface temperature anomalies, the likelihood of high-latitude blocking events, and a comparison with analog years. Elsewhere, the Great Lakes, Midwest and NE US should also experience slightly colder-than-normal temperatures and slightly above-normal snowfall this winter season while the western US is largely warmer and drier than normal.
Specifically, temperatures in the Mid-Atlantic region should average 1.5°C to 2.5°C below-normal for the winter season and snowfall estimates in the DC-to-Philly-to-NYC corridor are as follows:
~ 20 inches in Washington, D.C with ~25 inches in the DC suburbs including at Dulles Airport, VA;
~25 inches in Philadelphia, PA with ~30 inches in the Philly suburbs;
~30 inches in Central Park, NY and ~35 inches in the NYC suburbs.
Finally, there are likely to be winter-like periods with significant cold air outbreaks and even snow threats as we go through the remainder of the autumn season and – like many recent winters – this winter season is likely to have a late finish as we approach astronomical spring. We will continue to monitor all of these oceanic and atmospheric factors here at Perspecta Weather over the next several weeks and as we progress through the winter season of 2019-2020.
Meteorologist Paul Dorian
Perspecta, Inc.
perspectaweather.com
Video discussion: