12:00 PM (Thursday) | *Tropical threat on the table for the Gulf of Mexico region from late next week into the following (second) week of June*
Paul Dorian

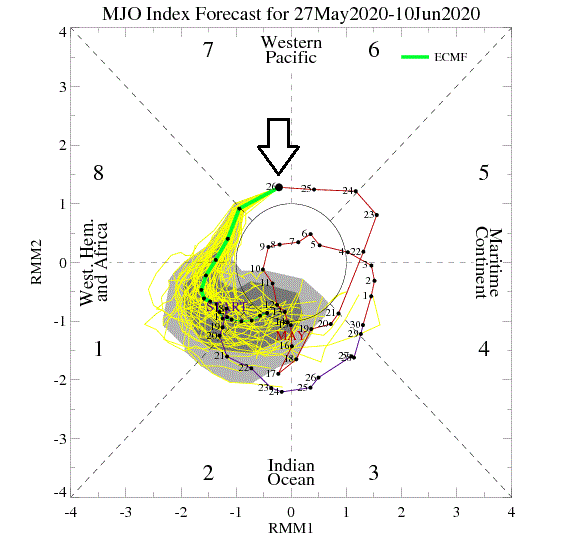
European model forecast of the Madden-Julian Oscillation (MJO) index from today (indicated by arrow) to June 10th (follow green line in a counter-clockwise fashion). Courtesy NOAA, ECMWF
Overview
The “official” Atlantic Basin tropical season begins on Monday, June 1st, but nature itself has, of course, gotten off to an early start. This actually continues a trend for a pre-June 1st start to the tropical season as there has been a named tropical (or sub-tropical) system in each of the last five years. Tropical Storm Arthur brushed the North Carolina coastline about ten days ago and Tropical Storm Bertha became the second storm of this young season and came ashore on Wednesday in South Carolina. There are signs that the active and early start to the 2020 tropical season will continue as we transition into the month of June which begins on Monday. In fact, there are reasons to believe that the Gulf of Mexico region could feature a tropical storm or even a hurricane by late next week or during the following (second) week of June.

Composite maps are shown of sea level pressure anomalies based on “phase” of MJO during this time of year. There are below-normal pressures (in blue) over the Gulf of Mexico region (boxed area) while MJO is in phase 1 or phase 2. Courtesy NOAA
Madden-Julian Oscillation (MJO)
The MJO is a tropical disturbance that propagates eastward around the global tropics with a cycle on the order of 30-60 days. It is a large-scale coupling between atmospheric circulation and tropical deep convection (thunderstorms). The movement of the MJO not only has wide ranging impacts on the patterns of precipitation, surface temperatures, and atmospheric circulation in the tropics, but it also influences precipitation and temperature patterns across the globe.

12Z Wednesday Euro model forecast map of tropical storm probability percentages in the period June 3rd to June 6th. Map courtesy Weather Bell Analytics, ECMWF
Research and empirical observations have found that the location or “phase” of the MJO is linked with certain temperature and precipitation patterns around the world. The MJO phase diagram illustrates the progression of the MJO index through different phases, which generally coincide with locations along the equator around the globe. When the index is within the center circle, the MJO is considered weak, meaning it is difficult to discern. Outside of this circle, the index is stronger and will usually move in a counter-clockwise direction as the MJO moves from west-to-east. The very latest European model MJO index forecast propagates the MJO into phases 1 and 2 during the first ten days or so of the month of June (follow green line in a counter-clockwise fashion) and this tends to favor tropical activity in or near the Gulf of Mexico region this time of year.

During the Atlantic Basin tropical season, high pressure ridging across SE Canada or the Northeast US can result in an increased chance for tropical activity in the Gulf of Mexico, SW Atlantic or Caribbean Sea. Courtesy NOAA
Some model and observational support for early-to-mid June tropical activity
Another favorable sign for tropical activity in the Gulf of Mexico region or SW Atlantic is the likelihood for upper-level high pressure ridging to edge into the southeastern part of Canada or northeastern US by the second week or so of June as indicated by a recent model run of the ensemble version of the GFS. When high pressure ridging builds into this part of North America during the Atlantic Basin tropical season, it can result in the development or movement of tropical activity into the Gulf of Mexico, SW Atlantic or Caribbean Sea.

Actual sea surface temperatures in the Gulf of Mexico which should be warm enough to support the development or intensification of tropical activity. Map courtesy weathermodels.com (Dr. Ryan Maue, Twitter), NOAA
The surface forecast maps of some of the computer forecast models have also hinted at tropical activity in this region late next week or during the second week of June. In addition, sea surface temperatures in the Gulf of Mexico are generally above-normal for this time of year and plenty warm enough to support the formation of tropical activity. Water temperatures as high as 82 degrees (F) which is generally thought of as a minimum requirement for tropical activity are now being measured as far north as the 25 degrees (N) latitude.
Meteorologist Paul Dorian
Perspecta, Inc.
perspectaweather.com
Follow us on Facebook, Twitter, YouTube
Video discussion: