
11:45 AM | *Numerous teleconnection indices (MJO, SOI, NAO, AO) point to a stormy pattern*
Paul Dorian

Warmer-than-normal sea surface temperatures are currently located in the equatorial Pacific Ocean (i.e., moderate El Nino); courtesy CMC Environment Canada, NOAA
Overview
There is ample empirical evidence that environmental phenomena in one part of the world can have a causal connection to another part of the world and several of these “climate anomalies” are tracked by meteorologists through teleconnection indices. Several of these teleconnection indices are currently suggesting that a cold and stormy stretch of weather is coming to the Mid-Atlantic region which may result in numerous winter storm threats beginning as early as this weekend and perhaps continuing into the month of March.
The teleconnection indices analyzed here include the Madden-Julian Oscillation (MJO), Southern Oscillation Index (SOI), Arctic Oscillation (AO) and North Atlantic Oscillation (NAO). The MJO is related to a tropical disturbance that propagates around the global tropics on a regular basis. The SOI provides us with information on pressure differences across the Pacific Ocean and on the “El Nino Southern Oscillation” (ENSO) state. The AO and NAO indices provide us with information on the pressure and temperature patterns across the North Atlantic/Arctic region. All of these indices are heading into territory which suggests that a cold and stormy weather pattern is unfolding for the Mid-Atlantic region and it could last awhile.

The Madden-Julian Oscillation (MJO) index will propagate through phases 8, 1, 2 and 3 in coming weeks according to the latest Euro model forecasts; courtesy NOAA, ECMWF
Teleconnection indices: MJO, SOI, NAO, AO
The Madden-Julian Oscillation (MJO) is the major fluctuation in tropical weather on weekly-to-monthly timescales and can be characterized as an eastward moving “pulse” of clouds and rainfall near the equator that typically recurs every 30-to-60 days. The MJO phase diagram (above) illustrates the MJO index through different phases which generally coincides with locations along the equator around the globe.

Temperature anomalies composites for the different phases of the MJO index with phases 8, 1, 2 and 3 usually resulting in colder-than-normal conditions this time of year in the central and eastern US; data courtesy NOAA
When the MJO index is within the center circle, it is considered weak and when it is outside, it is stronger and usually moves in a counter-clockwise direction. The different phases of the MJO correlate well with different temperature and precipitation patterns around the world depending on the time of year. The current forecast of the relatively strong MJO (shown in green) suggests it will propagate through phases 8, 1, 2 and 3 in coming weeks which usually results in colder-than-normal weather this time of year in the central and eastern US.

The Southern Oscillation Index (SOI) has dropped sharply in recent days to well below zero; data courtesy Queensland Government (Australia)
The SOI index is based on observed sea level pressure differences between Tahiti and Darwin, Australia and provides information of the state of the Southern Oscillation. In general, prolonged periods of negative SOI values coincide with abnormally warm ocean waters across the tropical Pacific - typical of an El Nino. The latest readings of the SOI show a sharp drop into negative territory indicating El Nino is indeed strengthening in the tropical Pacific. As sea surface temperatures in the tropical Pacific Ocean increase, the southern branch of the jet stream tends to become activated with the added water vapor and lift provided by the warmer-than-normal water. In turn, an activated southern jet stream usually results in an active storm track across the southern US - and perhaps up along the eastern seaboard – all of which is more favorable for snow in the Mid-Atlantic region.

Arctic Oscillation (AO, top) and North Atlantic Oscillation (NAO, bottom) index forecasts (shown in red) for the next couple of weeks; maps courtesy NOAA
The North Atlantic Oscillation (NAO) is a weather phenomenon in the North Atlantic Ocean related to fluctuations in the difference of pressure between the Icelandic Low and Azores High. It is a close relative to the Arctic Oscillation (AO) which is a weather phenomenon in the Arctic region and is connected to pressure anomalies in that region. The NAO and AO indices track these pressure patterns and vary over time from positive-to-negative and can provide us with information on the likelihood for wintertime cold air outbreaks to reach into the eastern US and whether or not these cold air outbreaks can be sustained.

Composite temperature anomalies are shown for the month of February if the Arctic Oscillation (AO, left) and North Atlantic Oscillation (NAO, right) are in negative territory; data courtesy NOAA, madusweather.com
If the AO index drops into negative territory for a prolonged period of time then wintertime cold air outbreaks into the eastern US are more likely to take place. If the NAO goes negative at the same time then the cold air outbreaks are likely to be more sustained as high-latitude blocking (i.e., higher pressure than normal) usually sets up in this scenario over places like Greenland and northern Canada. Both of these indices are forecasted to drop into negative territory in coming days which is usually more favorable for cold air outbreaks around here and more favorable for the cold air masses to stick around for awhile.

Multiple waves of energy in the upper atmosphere by the middle of the upcoming weekend in an unfolding active and stormy weather pattern; courtesy NOAA/EMC, tropicaltidbits.com
Multiple storm threats next 7 days
The unfolding cold and stormy weather pattern looks like it could get underway in earnest as early as this weekend with not one, but two low pressure systems to closely monitor. After a mild end to the work week on Friday with temperatures likely reaching the 50’s in the DC-to-Philly-to-NYC corridor, the passage of a strong cold frontal system will usher in a colder air mass for the upcoming weekend. That frontal boundary zone will then stall out across the southern Mid-Atlantic and act as a conduit for two separate low pressure systems to move along. One low pressure area looks like it may generate snow or a wintry mix in the Mid-Atlantic region from late Friday night into Saturday – perhaps with the accumulating snow confined roughly to the region from DC-to-Atlantic City, NJ. A second and perhaps stronger low pressure system may follow on its heels and could result in more snow or a wintry mix in the Mid-Atlantic from later Sunday into Sunday night - perhaps more of a snow threat this time to the north of the PA/MD border. Finally, there are signs for a third storm threat by the middle of next week which could trek across the southern states and it too can result in snow or a wintry mix in this area from late Tuesday into Wednesday.
California update
A powerful Pacific Ocean storm is slamming into California today and it will bring heavy coastal rains, damaging wind gusts and incredible amounts of snow to the Sierra Nevada Mountains over the next few days. The worst of the storm will take place in central and northern California where localized flooding, erosion, mudslides and power outages are a serious concern, but significant rains will extend all the way down the coastline. Wind gusts are possible during this storm to 60 mph in coastal sections and 90+ mph along inland ridge tops. Snowfall has more than made up from a big deficit in December with many mountain areas now running close to or above average for the season with more big winter storms to go. The depth of the snow cover over the High Country ranges from 6-12 feet as of Monday morning. The snowfall from this latest storm system may not be measured in inches or feet for the Sierra Nevada Mountains, but rather in terms of yards.
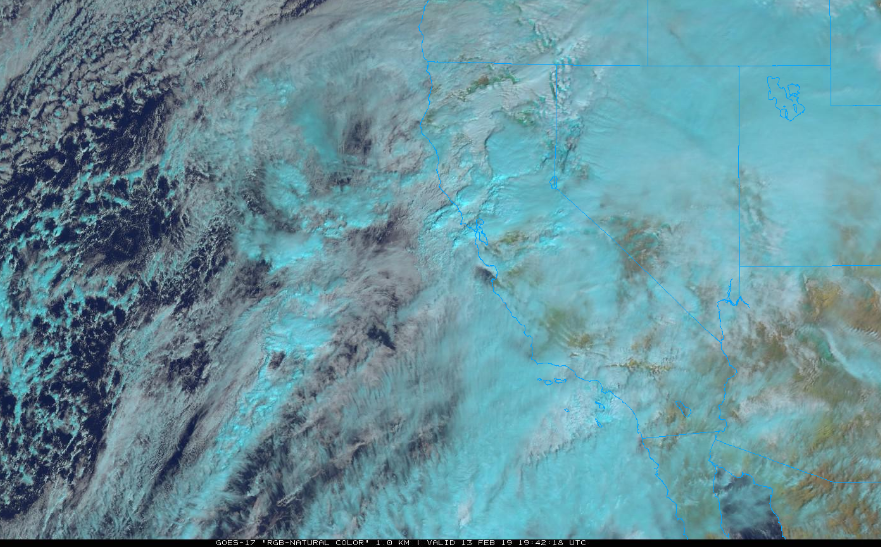
GOES-17 satellite image of the western US/eastern Pacific region featuring clouds associated with the latest storm to slam into California; courtesy NOAA, College of DuPage