
12:00 PM | *Interesting recent developments with respect to El Nino in the tropical Pacific*
Paul Dorian

Sea surface temperature anomalies have been rising sharply in recent days across the centrally located Nino section known as “3.4”. Data courtesy NOAA, tropicaltidbits.com
Overview
After back-to-back-to-back La Nina (colder-than-normal water) winters, El Nino (warmer-than-normal water) has formed in the tropical Pacific Ocean and it will play an important role in the upcoming winter season across the nation as discussed in the Arcfield Weather 2023-2024 “Winter Outlook”. Two aspects of El Nino are important when it comes to its potential impact on winter weather patterns in the US and they include both its magnitude and location. Evidence continues to mount suggesting this El Nino event will not rival some of the strongest episodes in recent history such as in 2015-2016, 1997-1998 or 1982-1983. Instead, and as outlined in the “Winter Outlook”, it appears this El Nino will be one of moderate strength and will tend to weaken as we progress through the winter season. In terms of the location with respect to the greatest sea surface temperature anomalies in the equatorial Pacific, the thought was that an “eastern-based” focus would shift to more of a “central-based” and recent developments suggest this transition may already be getting underway.

Sea surface temperature anomalies have been declining in recent days across the eastern-most Nino section known as “1+2”. Data courtesy NOAA, tropicaltidbits.com
The magnitude of El Nino
In terms of the magnitude of an El Nino event, one of the best ways meteorologists can determine strength is by looking at the atmospheric response. While the sea surface temperature anomalies can make it look like a strong El Nino event, this literally may be just looking at the surface and not getting the best picture. Indeed, one index that is used by meteorologists to help determine the actual strength of an unfolding El Nino is known as the “multivariate ENSO” (MEI) and, as the name would suggest, it factors in multiple atmospheric and oceanic parameters. In addition to sea surface temperatures, this index factors in information on sea-level pressure, u/v components of the surface wind, and outgoing longwave radiation and it is thought that this approach captures better the overall representation of the strength of an El Nino.
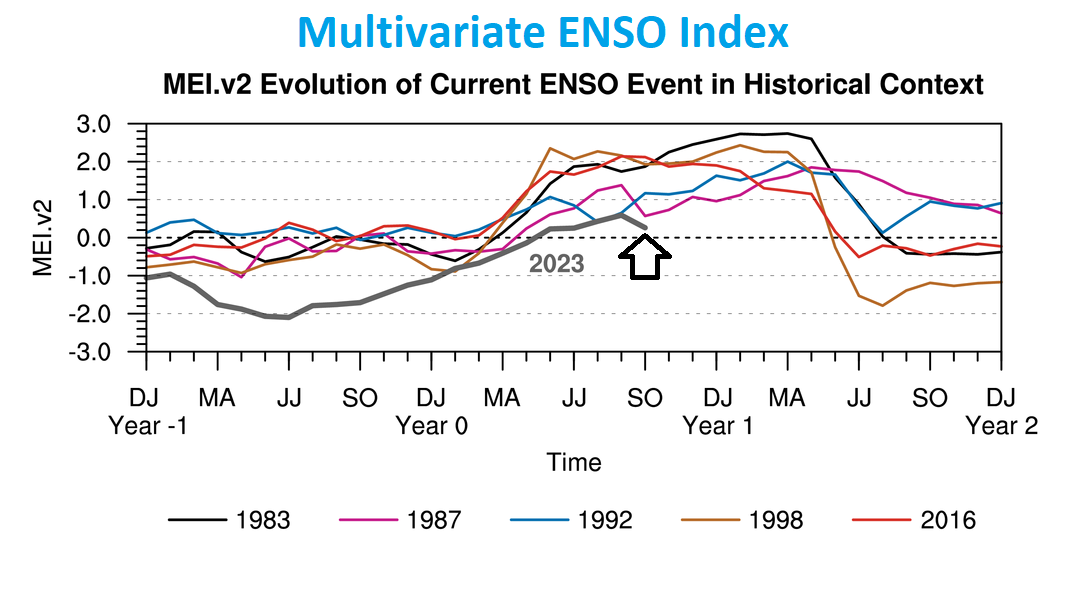
One of the best ways to monitor the strength of an El Nino is to look at the overall response in the atmosphere. This plot shows the trend of an index value known as the “multivariate ENSO” (MEI) which factors in such parameters as pressure, winds, and outgoing longwave radiation in addition to the more conventional sea surface temperature anomalies. The latest reading of the MEI (indicated by arrow) suggests this El Nino may not be nearly as impactful as several recent strong-to-super strong El Nino events. Map courtesy NOAA
The MEI is computed separately for each of twelve sliding bi-monthly seasons (Dec/Jan, Jan/Feb, …Nov/Dec) and a comparison of the latest MEI reading to strong El Nino events in recent history suggest this one is relatively weak. In fact, the most recent calculations of the MEI indicate the relatively weak index value is slowly declining as we head into the winter season.

The tropical Pacific Ocean is broken up into small sections in order to better track sea surface temperature trends with section “1+2” (red) the eastern-most located just off the west coast of South America and “3.4” (green/blue mesh) positioned in the central part of the equatorial Pacific. Map courtesy NOAA
The location of El Nino
In terms of the location of an El Nino event, meteorologists track sea surface temperature (SST) changes in the equatorial part of the Pacific Ocean by dividing the region into several small sections. The eastern-most section is known as “1+2” and sits just off the west coast of South America and the section known as “3.4” is positioned in the central part of the tropical Pacific. Temperature trends in these particular two sections give us an idea as to whether the El Nino is more of an eastern-based event or a central-based episode or perhaps a hybrid with something in between.

Sea surface temperature anomalies across the tropical Pacific Ocean certainly support the idea of an El Nino event. The atmospheric response to the El Nino event is captured in the “multivariate ENSO” index and it suggests this El Nino may not be nearly as impactful as some recent strong-to-super strong episodes. Map courtesy NOAA, tropicaltidbits.com
The latest sea surface temperature anomaly observations show an interesting sharp uptick in the central-based section of “3.4” at the same time the trend is down in the eastern-most section of “1+2”. In fact, the latest specific measurement of the SST anomaly in the central-based section of “3.4” is +1.69 (°C) (and rising) - at the same time - the latest reading in the “1+2” section is +1.06 (°C) (and dropping)…this supports the idea of more of a central-based El Nino event for the upcoming winter season.
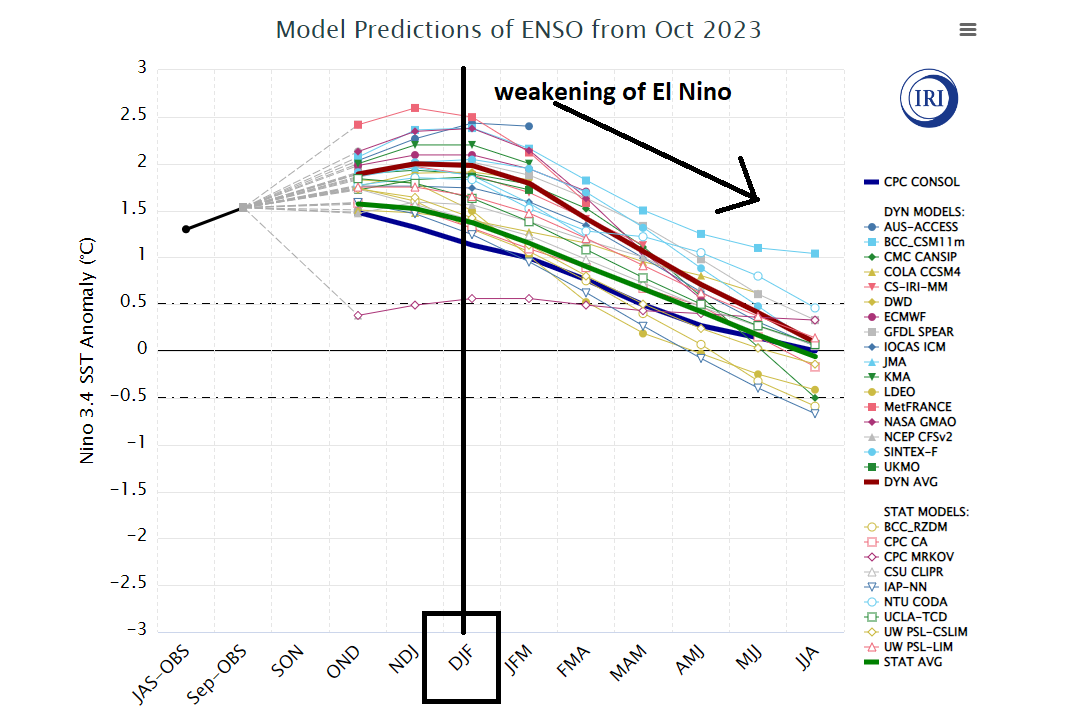
Almost all computer forecast models favor the idea of a weakening El Nino as we progress through the 2023-2024 winter season. The vertical line on the plot represents the “December/January/February” sea surface temperature anomaly values as depicted by numerous models in the “3.4” region of the tropical Pacific and the overall trend is for weakening as the winter season progresses. Map courtesy IRI/CPC
Bottom Line
The bottom line is that recent observations suggest the unfolding El Nino in the tropical Pacific Ocean is not going to reach the strength of some recent strong-to-super strong episodes (e.g., 2015-2016, 1997-1998, 1982-1983) and it appears it is shifting to more of a “central-based” event rather than “eastern-based”. While there are many other factors involved in a weather pattern across the nation during a winter season, a moderate strength and centrally-based El Nino tends to favor a colder, snowier weather pattern across the eastern half of the nation. This kind of El Nino typically results in strong ridging to form near the US and Canadian west coasts which, in turn, favors cold air outbreaks into the central and eastern states whereas a strong-to-super strong, eastern-based El Nino event in the wintertime often simply overwhelms much of the nation with milder-than-normal air.
Stay tuned…we’ll continue to monitor all of this in the coming weeks.
Meteorologist Paul Dorian
Arcfield
arcfieldweather.com
Follow us on Facebook, Twitter, YouTube
Video discussion: